
Consistency Analysis of All-tab Prismatic Winding Batteries
Nov 15, 2023


Follow me on:
Lithium-ion batteries are typically combined in series or parallel to form a power battery pack in order to meet the performance requirements. As the number of individual batteries increases, the issue of battery consistency becomes more prominent. Inconsistency in batteries can lead to a range of problems such as reduced battery lifespan, decreased performance, and compromised safety of the battery pack. The inconsistency of individual batteries mainly stems from the manufacturing or storage process as well as the usage process.
During the production process, inconsistency is often indirectly reduced by controlling the manufacturing process accuracy. However, this can only minimize the initial parameter differences and cannot completely eliminate them. The consistency of batteries exhibits transitivity and cumulativity, as it is influenced by multiple interacting factors. Even slight differences in initial parameters can be greatly magnified during usage.
To improve this situation, we can take a combined approach from various aspects such as battery production, battery sorting, battery balancing, and thermal management of the power battery pack. This article shares the test data of the production process of all-tab prismatic winding lithium-ion power batteries and analyzes their consistency.
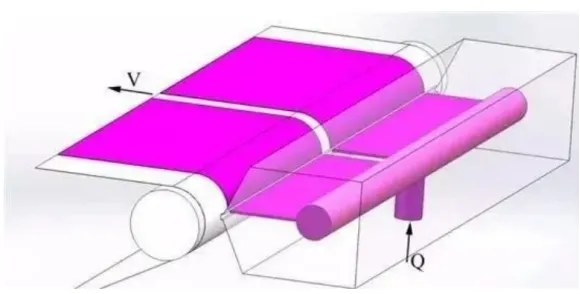
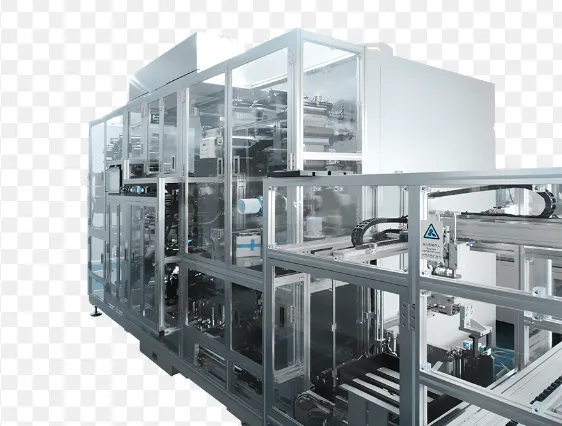
The specific design and production process of the battery are as follows: The positive electrode material of the battery uses a ternary system, while the negative electrode uses artificial graphite. The battery is assembled in a winding manner and encased in an aluminum shell. The process of electrode sheets, winding jelly rolls, and battery assembly is shown in Figure 1.
During the winding of the all-tab battery, the arrangement of the electrode sheets and separators is as shown in Figure 1. The side edges of the positive electrode sheet (15) without coating during the application of positive electrode material (30) and the blank side (14) of the negative electrode sheet while applying negative electrode material (40) are respectively welded as ear tabs on the positive and negative current collectors. The positive and negative electrode sheets are separated by a separator (170), and the positive and negative current collectors are exposed on both sides of the winding jelly roll, directly connected to the positive and negative electrodes of the battery.
By improving the power characteristics from the perspective of tabs, the current flow distance is shortened, resulting in a uniform current density distribution at high discharge rates, enabling high power density and reducing heat generation from the electrode sheets.
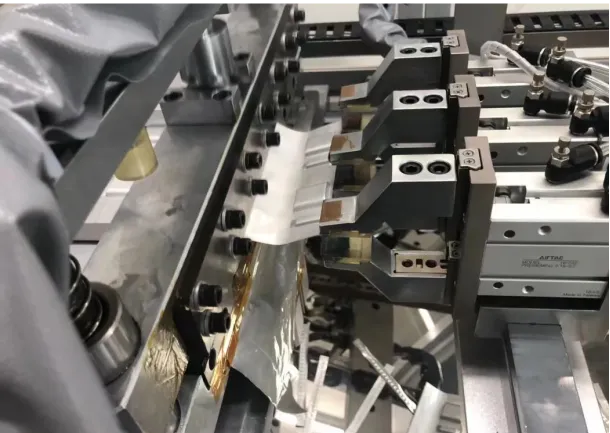
After assembling the top cover, the positive electrode tab with blank current collector is welded to the positive busbar, and the negative electrode tab with blank current collector is welded to the negative busbar using laser welding or resistance welding. When the design capacity is large, two winding jelly rolls can be connected in parallel. During the welding process, multiple winding jelly rolls can be first connected in parallel and then welded together, or each winding jelly roll can be individually welded and then multiple winding jelly rolls are connected in parallel after laser welding.
The winding jelly rolls with insulated film-coated welded tabs are inserted into the casing, and the top cover and casing are welded together using laser welding. After the battery is dried, it is filled with electrolyte and pre-charged. The opening of the battery is sealed with a sealing nail, covered with an aluminum sealing plug, and then the sealing plug is welded onto the battery top cover to seal the cell completely.
Consistency in electrode sheets production
The positive and negative electrode sheets are coated using a slot die extrusion coating technique, with constant roll gap modecalendering using a hydraulic servo rolling mill.
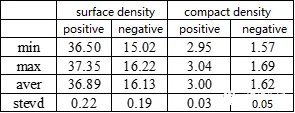
During the electrode coating and calendering process, electrode sheets with a length of approximately 500m are collected as a roll and undergo initial and final inspections as a batch. A sampler cuts circular samples with a diameter of φ60mm, and the weight and thickness of the electrode sheets are measured. The surface density and compact density of the electrode sheets are calculated, with 3 samples taken for testing and data calculation per batch.
The test data for the positive electrode sheets are shown in Figure 2 and Figure 3. The average surface density of the electrode sheets on both sides is 36.89 mg/cm2, indicating good coating stability. The calendering of the electrode sheets determines the compact density of the coating by controlling the thickness of the electrode sheets. After calendering, the compact density of the positive electrode is controlled at 3.00 g/cm3, with minimal thickness fluctuations and good stability.
The test data for the positive electrode sheets are shown in Figure 2 and Figure 3. The average surface density of the electrode sheets on both sides is 36.89 mg/cm2, indicating good coating stability. The calendering of the electrode sheets determines the compact density of the coating by controlling the thickness of the electrode sheets. After calendering, the compact density of the positive electrode is controlled at 3.00 g/cm3, with minimal thickness fluctuations and good stability.
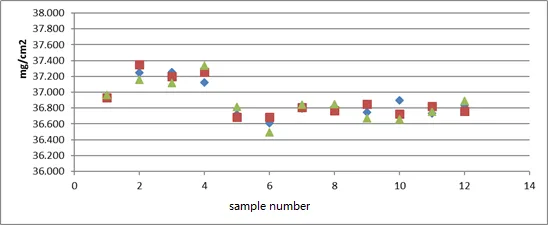
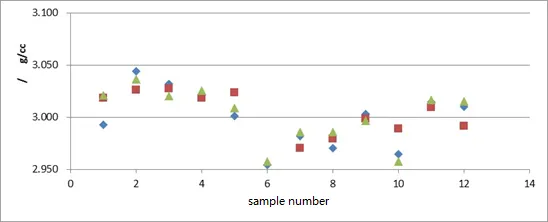
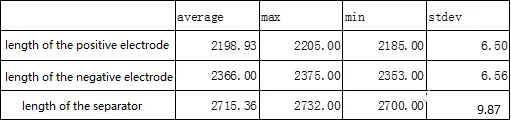
The test data for the negative electrode sheets are shown in Figure 4 and Figure 5. The average surface density of the electrode sheets on both sides is 16.13 mg/cm2, indicating good coating stability. The calendering of the electrode sheets determines the compact density of the coating by controlling the thickness of the electrode sheets. After calendering, the compact density of the negative electrode is controlled at 1.62 g/cm3, with minimal thickness fluctuations and good stability. Lastly, the ranges, averages, and standard deviations of the surface density and compact density for both positive and negative electrode sheets are summarized in Table 1.
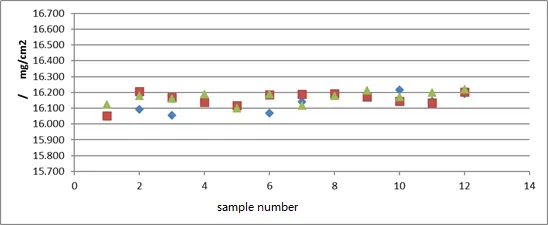
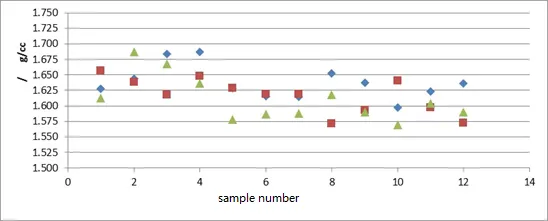
Table 1: Surface Density and Compact Density of Positive and Negative Electrode Sheets
After winding, the jelly roll requires extensive testing to ensure product quality, including:
(1) Cell dimensions, including height, width, thickness, tape width and position, alignment of tab collectors, etc. These dimensions can be directly measured and are related to winding process and equipment precision.
(2) Length of electrode sheets and separators.
(3)Width of electrode sheets. In the width direction, the negative electrode needs to exceed the positive electrode by a certain margin, and the separator needs to exceed the negative electrode by a certain margin. The alignment in the width direction is directly determined by the precision of the winding process. When the precision is high, the margin dimensions can be smaller, resulting in higher energy density of the battery. However, the safety margin of the battery decreases, and it is crucial to ensure process precision to avoid significant safety risks. The alignment of each layer of electrode sheets in the cell is generally achieved by X-ray inspection of all four corners of the cell. When the relative width dimension between the positive and negative electrodes does not meet the requirements, the equipment automatically alarms and rejects the defective products.
(4) jelly roll quality.
(5) Burrs on electrode sheets. The cutting knife used for electrode sheet cutting can experience wear and tear over time, affecting the cutting quality. Therefore, the cutting knife needs to be managed for its lifespan, and regular inspections of cutting quality need to be conducted to avoid burrs. The typical process for observing burrs is to take a cut electrode sheet and examine the cut surface under an optical microscope to detect the presence of burrs. The control standard for burrs is generally that the burr size should be smaller than half the thickness of the separator. However, some manufacturers have stricter control requirements, where burrs should not exceed the coating.
(6) Other internal defects in the jelly roll, such as electrode sheet bending, coating orientation, foreign objects, etc.
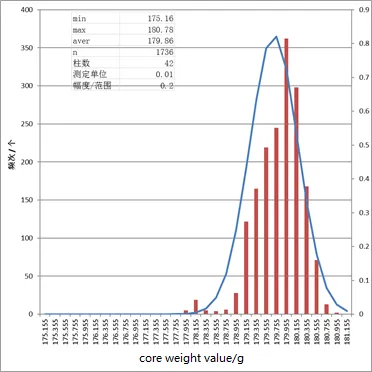
The analysis of jelly roll quality selection is shown in the data histogram in Figure 6. The histogram is processed using collected jelly roll data to reflect the distribution of product quality, allowing for the assessment and prediction of product quality and non-conformity rates. When analyzing statistical data, the data is divided into several groups based on different ranges, and the number of groups is referred to as the number of bins. The distribution of jelly roll quality follows a normal distribution, with an average mass of 179.86g. There is a higher quantity of jelly rolls within the mass range of 177.955-178.155g, deviating from the normal distribution.
During the processing of electrode sheets, markings are made on defective sheets with issues such as single-sided coating or exposed foil, and these defective sheets are removed during winding. However, defective sheets still occasionally appear in the jelly roll. Conducting quality inspections on the jelly rolls and removing non-conforming products can further ensure product quality.
The main cause of abnormal quality inspection results is the generation of defective sheets during the electrode sheet processing, such as coating inconsistencies, single-sided coating, and the presence of tape defects on the electrode sheets.
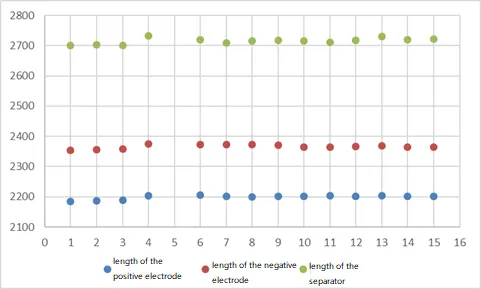
Partial jelly roll disassembly destructive testing was conducted, primarily analyzing the length data of the positive electrode, negative electrode, and separator. The specific results are shown in Figure 7, with the positive electrode length approximately 2.20m and the negative electrode length approximately 2.37m. In order for lithium ions from the positive electrode to diffuse and be accommodated in the negative electrode lattice, the negative electrode must fully enclose the positive electrode with a certain size margin. Additionally, to prevent short circuits, the separator must encapsulate the negative electrode. In the length direction of the wound cell, it is necessary to ensure that the negative electrode has a margin compared to the positive electrode, and the separator must enclose the negative electrode. The relative positioning of the electrode sheets is crucial, including parameters such as separator length, relative dimensions to the negative electrode, and the relative positioning between the positive and negative electrodes. These dimensions are influenced by electrode coating specifications, winding processes, and other factors.
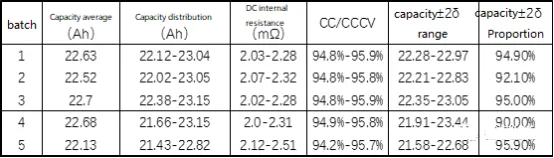
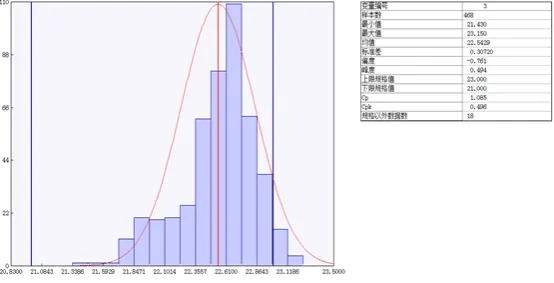
After the battery is assembled, charge and discharge to test the battery’s capacity, DC internal resistance and other parameters. Capacity distribution is the accumulation of all process influencing factors of the battery. This parameter can be used to analyze the consistency of the battery and integrate the errors of all processes. The battery capacity distribution is shown in Figure 8 and Table 2. Process capability is the ability of a process to ensure product quality when it is in a steady state. It is comprehensively affected and restricted by factors such as operators, machinery and equipment, raw materials, process methods, and working environment in the process. It is reflected in two aspects: whether the product quality is stable and whether the product quality accuracy is sufficient. As shown in Figure 9, based on the battery capacity data, the process capability of battery production is comprehensively analyzed, CP=1.085, and the battery production capacity meets the requirements.
Process capability determination:
1.Cp>1.33. When Cp>1.33, it indicates that the process capability is sufficient. At this time, it is necessary to control the stability of the process to prevent significant changes in process capability. If the process capacity is considered to be too large, the standard requirements and process conditions should be analyzed. On the one hand, the requirements can be lowered to avoid the waste of equipment accuracy. On the other hand, the standards can also be revised to improve product quality.
2. 1.0<cp≤1.33. When the process capability index is between 1.0 and 1.33, it indicates that the process capability meets the requirements but is not sufficient. When the cp value is very close to 1, there is a risk of exceeding the tolerance, and measures should be taken to strengthen the control of the process. < span=””></cp≤1.33. When the process capability index is between 1.0 and 1.33, it indicates that the process capability meets the requirements but is not sufficient. When the cp value is very close to 1, there is a risk of exceeding the tolerance, and measures should be taken to strengthen the control of the process.
3. 0.67<cp≤1.0. When the process capability index is between 0.67 and 1.0, it indicates that the process capability is insufficient and cannot meet the needs of the standards. Improvement measures should be taken, changing process conditions, revising standards or strictly conducting full inspections, etc. < span=””></cp≤1.0. When the process capability index is between 0.67 and 1.0, it indicates that the process capability is insufficient and cannot meet the needs of the standards. Improvement measures should be taken, changing process conditions, revising standards or strictly conducting full inspections, etc.
4.Cp≤0.67. When the process capability index is less than 0.67, it indicates that the process capability is seriously insufficient, and work must be stopped for rectification if necessary.
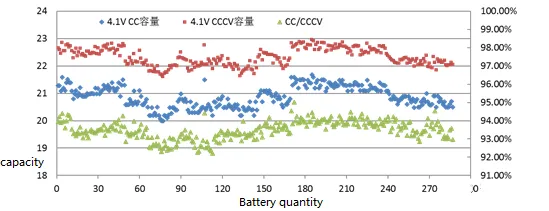
Table 2 Battery capacity distribution data